Using Market Value to Realized Value to estimate market tops and bottoms
Market Value to Realized Value (MVRV) has historically been one of the most accurate on-chain indicators for estimating bitcoin market tops and bottoms. This article explains how to interpret the indicator and discusses some trading strategies based on it.One of the advantages of the open blockchain is that it opens up for on-chain analysis, giving traders and analysts much more data to work with. Many on-chain indicators have historically been handy in estimating the supply and demand conditions for crypto assets. One of these indicators is the Market Value to Realized Value (MVRV). As explained in this article, the indicator is especially suited for finding entry and exit points for medium-term traders and long-term investors.Calculating the MVRV
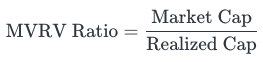
We find Market Value to Realized Value (MVRV) by dividing the market value by the realized value. Adding together all the UTXOs (units) valued at the price when they last were moved gives us the realized value. The realized value can be viewed as the cost basis of the network, so we can use MVRV as a proxy to estimate the unrealized profit that is latent in the network. The market value is another word for market cap.How can MVRV estimate market tops and bottoms?
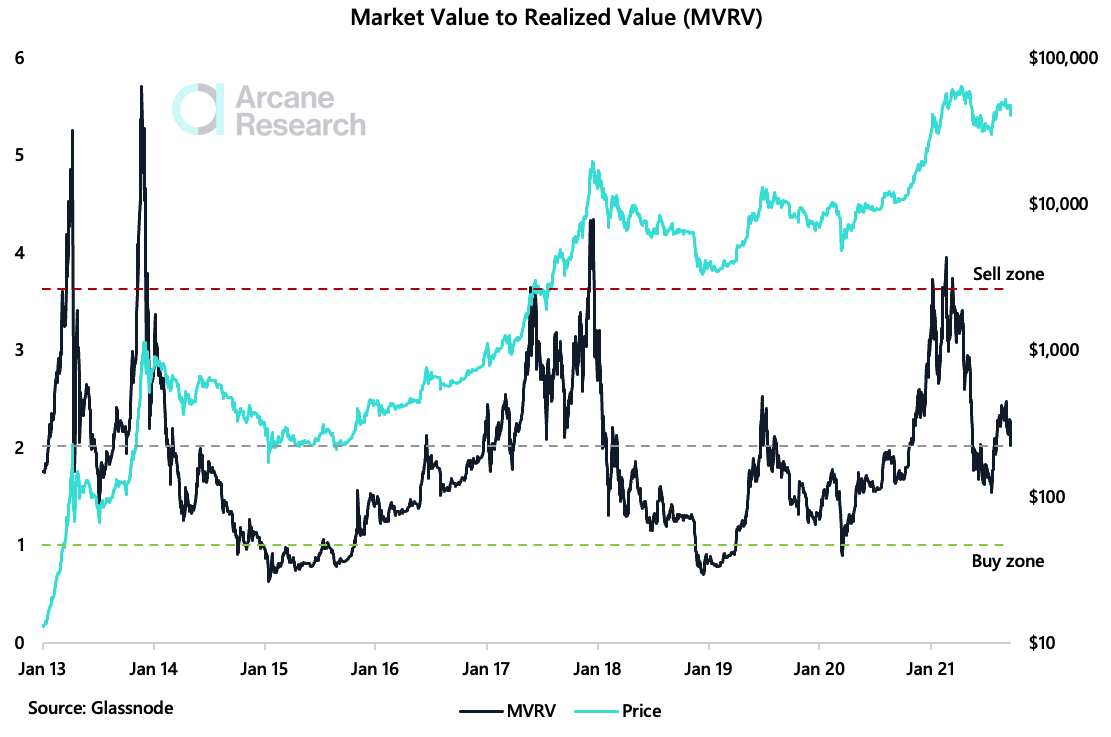
MVRV can be used to estimate when the price is above or below fair value. For example, during the bull market in the spring of 2021, MVRV topped out at 3.96, the highest level seen since December 2017, when it briefly reached 4.72. Conversely, when the market bottomed out in the middle of July, it briefly touched 1.54. Cryptoquant has set an upper threshold (sell) for bitcoin at 3.7 and a lower point at 1 (buy). From the chart above, we can see that since the start of 2013, bitcoin’s MVRV has only lied below 1 for short periods, and it has only happened close to the bottom of the worst of the worst bear markets. At this point, the price is suppressed, and it’s possible to snap up cheap coins. An MVRV lower than 1 means that the asset’s market cap is lower than the total cost basis. In other words, very few holders have unrealized profits. Human emotions drive the market, and because it’s tough for most people to cut a loss, most will avoid selling until profit. Conversely, when the MVRV is very high, it means that most holders are sitting on unrealized gains.Simulating trading strategies based on MVRV
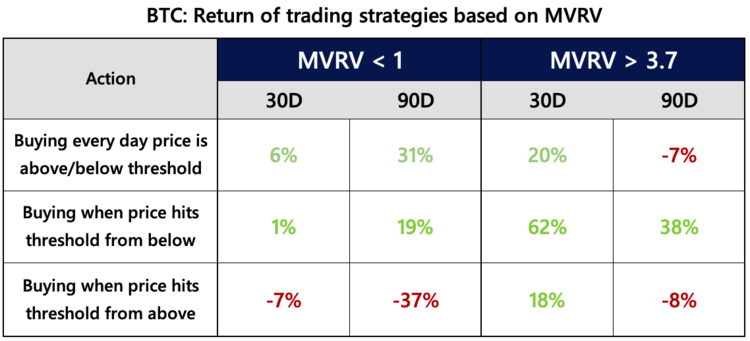
MVRV is best used as a medium to long-term metric. Using Cryptoquant’s thresholds for buy and sell, we can simulate a trading strategy based on MVRV and look at the historical returns. As shown in the table, history from January 1st, 2013 shows that buying the same amount of bitcoin every day when MVRV is lower than 1 has given 31% returns on average during the subsequent 90-day period. On the other hand, buying the same amount of bitcoin every day when MVRV was above 3.7 has given an average 90-day return of -7%. The divergencies in 90-day returns between buying when MVRV is below 1 or above 3.7 are also apparent when examining the chart. MVRV usually spikes above 3.7 in the late phases of bull markets, just weeks before the air goes out of the balloon. Buying the same amount every day is not typical for medium-term traders but is more desirable for long-term investors. For them, it is advisable to use this as an opportunity to get cheap coins for long-term hodling.For medium-term traders, things get more interesting. As shown in the table, buying when MVRV hit 3.7 from above and holding for 30 days has yielded 62% returns on average. The reason is that bull markets historically have ended about one month after the 3.7 level was hit. In addition, the last phase of a bull market is usually the phase with the most extreme returns. By selling when MVRV passes 3.7, you will most likely miss the latest and wildest part of the bull market. The exact mechanism also happens when MVRV falls below 1. Although the level below 1 is an excellent place for long-term holders to buy cheap coins, buying immediately when MVRV falls below 1 from above and holding for 30 or 90 days has historically given returns of -7% and -37%.When has the MVRV tipped above the selling signal of 3.7, and what happened the following days?
The table above shows that our best trading strategies based on MVRV historically have been to buy when the MVRV hits 3.7 from below. We will now go through some examples of when this happened.The first bull market of 2013
MVRV hit 3.7 on March 20th, 2013, when the bitcoin price was $64. 30 days later, the bull market was in its latest stages, and the price hit $126 on April 20th, 2013. If you had sold when MVRV hit 3.7, you would have missed a 49% gain.The second bull market of 2013
On November 11th, 2013, MVRV hit 3.7. The bitcoin price was then $344. By holding for 30 days more before selling at $877 on December 10th. 2013, you would have netted a 155% gain.The bull market in late 2017
On December 6th, 2013, MVRV passed 3.7. The price was then $13,920. When 30 days had passed, on January 5th, 2018, the market had already reached its top, but the price of $16,930 was still 22% higher than 30 days ago.The bull market in early 2021
The 3.7 level was hit on February 17th, 2021, when the bitcoin price was $52,138. The bull market continued slowly but surely from this level, and the price reached $58,374 30 days later, on March 19th, 2021. The price continued to climb for one more month before peaking out at around $64,000.Final considerations when using MVRV
In the past four big bull markets, the best strategy has been to wait around one month to sell after MVRV hit 3.7. The same is valid on the downside. In bitcoin’s bear markets, it has not paid off to buy immediately when MVRV falls below 1, but instead wait about a month until the market has had time to turn around. Trading strategies can also be created based on this, for example, buying when MVRV goes above 3.7 from below and selling after 30 days. This may seem counter-intuitive, but since 2013 this momentum-based trading strategy has given 62% 30-day returns on average. And for long-term investors, the level below 1 is usually a great place to snap up cheap coins, giving an average 90-day return of 31% by buying every day the MVRV stays below 1.